Debugger plays an important role in any development platform. As much stronger the debugger is, as less consumption of debugging time. SQL Server 2012 came with the strong debugging techniques that will reduce your time and efforts as well. But how ?
Before proceeding with the explanation of debugger, let me create an example to demonstrate debugger features.
Example :
USE AdventureWorks2012
GO
DECLARE @BusinessEntityID INT,
@FirstName VARCHAR(50),
@SalesQuota NUMERIC(18,2)

DECLARE Database_Cursor CURSOR FOR

Select top 4 BusinessEntityID,FirstName,SalesQuota
from [Sales].[vSalesPerson]

OPEN Database_Cursor

FETCH NEXT FROM Database_Cursor
INTO @BusinessEntityID, @FirstName, @SalesQuota

WHILE @@FETCH_STATUS = 0
BEGIN
PRINT CONCAT(@BusinessEntityID,' '
, @FirstName,' ' ,@SalesQuota)

FETCH NEXT FROM Database_Cursor
INTO @BusinessEntityID, @FirstName, @SalesQuota
END
CLOSE Database_Cursor
DEALLOCATE Database_Cursor
GO

How to start debugger :
Before proceeding with the features, let me tell you how to run the debugger.
Go to Debug menu and select Start Debugging or Press (Alt +F5) as shown in the picture.

Let me explain the feature of debugger in detail.
Feature 1 : (Cannot put the breakpoint in any invalid location)
This is one of the nicest features in debugger that will stop you putting unnecessary breakpoints on INVALID location.
Given below is the screen image :

Feature 2 : (Define Condition)
In the earlier version of SQL Server, we could place the breakpoint but we could not put any condition inside the breakpoint.
In SQL Server 2012, you can easily put the condition inside the breakpoint, so even if there is a breakpoint and if it does not meet the criteria, it will not stop the debugger.
Let me show you step by step, how to put the breakpoint condition.
Step 1 :
First of all, place your cursor, where you need to place the breakpoint in the query editor window and PRESS F9.
Step 2 :
Right click on the breakpoint and select Condition as shown in the picture below.

Step 3 :
Once you get in the condition window just define the condition and PRESS OK.
Now the debugger will not stop at each and every row. It will only stop once debugger meets the criteria (@BusinessEntityID=275).

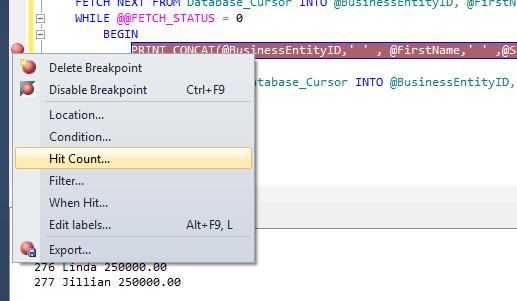
Feature 3 : (Delete/Disable Breakpoint)
Sometime, we partially finish the debugging, so we usually delete the breakpoint from line of code we already debugged. In my recommendation, until unless you finish the debugging do not delete the breakpoint, just disable it. Both disable and delete breakpoint options are available on right click of the breakpoint, as shown in the picture below.

Note : You can also disable / delete all breakpoints altogether from DEBUG menu as shown in the picture below.

Feature 4 : (Hit Count)
Sometimes we place the condition in the breakpoint (as explained in feature 2) but we do not want to stop whenever the condition meets. Instead we want to stop debugger if breakpoint criteria meets with certain number of times. (This feature is very handy whenever you are dealing with large data.)
Let me show you step by step, how to put the hit count condition.
Step 1 :
First of all, put a breakpoint.
Step 2 :
Right click on breakpoint and select Hit Count as shown in the picture below.
Step 3 :
Once you get inside the Hit Count window, by default it is break always but you can change it to any condition as shown in the picture below.


Reblogged this on Sutoprise Avenue, A SutoCom Source.